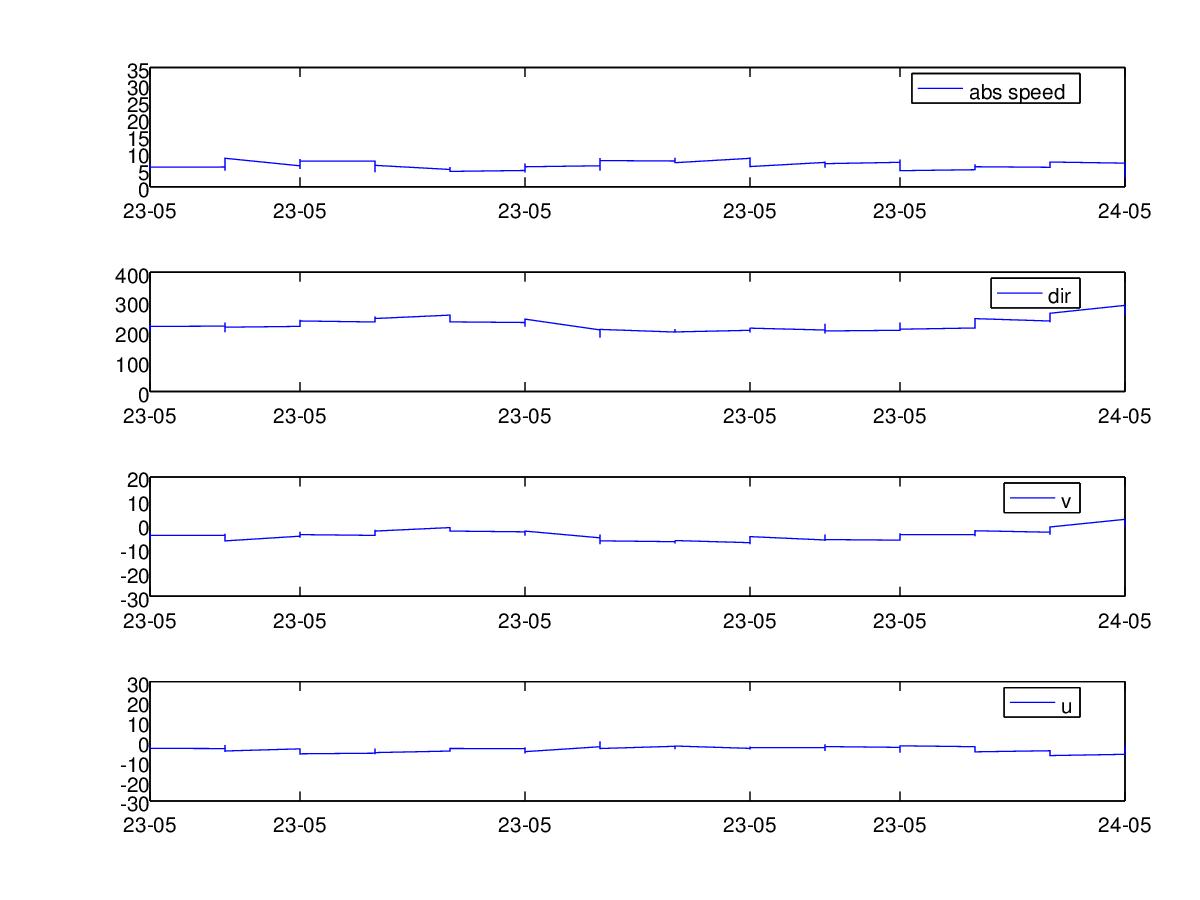
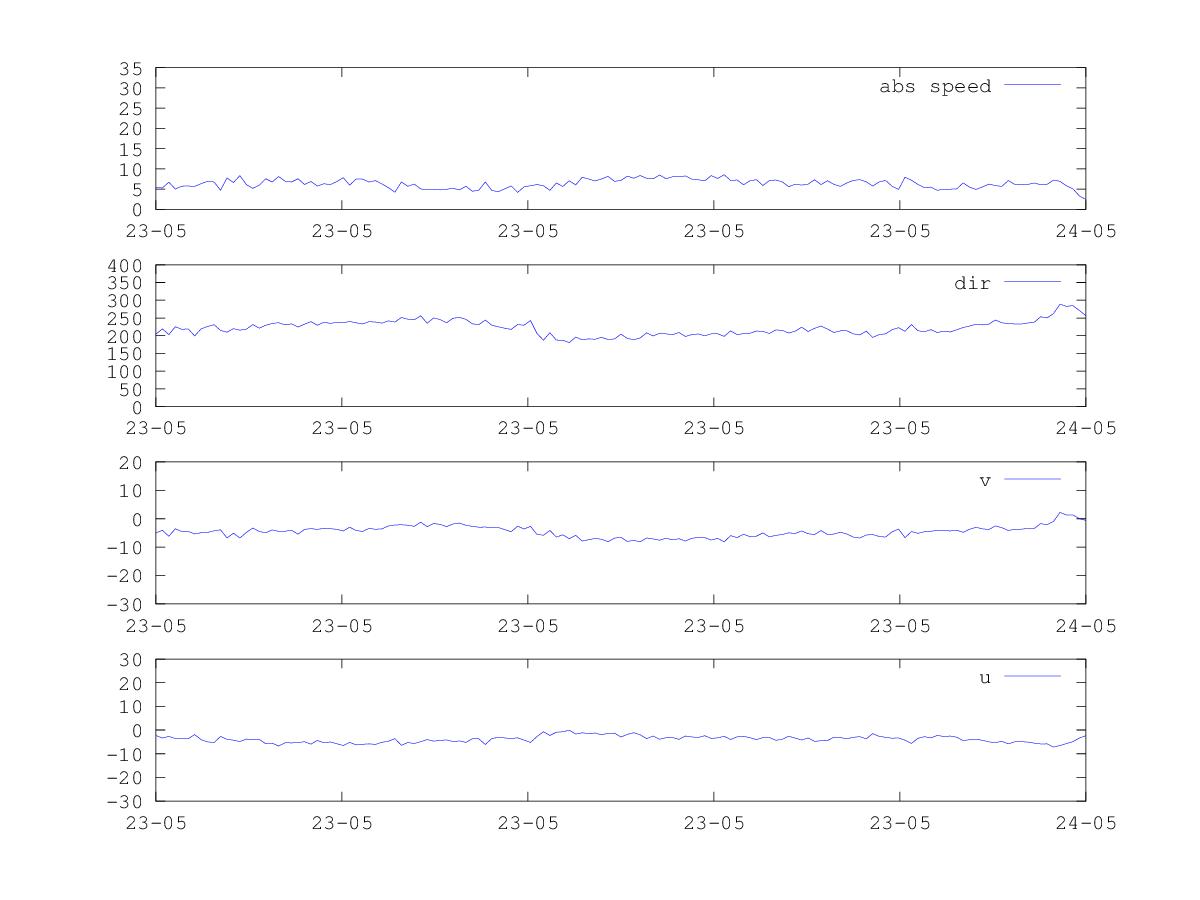
Package: octave
Version: 3.8.2-4
Severity: important

Dear Maintainer,

The bug arises using Octave 3.8.2, when plotting an array of data with
dimension of 14327x1 against an array of times. Times is an array created with
datenum with a step of 10 minutes between data.
The trend of plotted data is made by segments and it is not continuous as it
should be.
Plotting data alone, not against time, or using Octave 3.6.2 gives a correct
curve. I send you 2 figures to explain better the bug.

Marco


-- System Information:
Debian Release: 8.0
  APT prefers testing
  APT policy: (500, 'testing'), (500, 'stable'), (500, 'oldstable')
Architecture: amd64 (x86_64)
Foreign Architectures: i386

Kernel: Linux 3.16-2-amd64 (SMP w/8 CPU cores)
Locale: LANG=en_GB.UTF-8, LC_CTYPE=en_GB.UTF-8 (charmap=UTF-8)
Shell: /bin/sh linked to /bin/dash
Init: systemd (via /run/systemd/system)

Versions of packages octave depends on:
ii  default-jre-headless             2:1.7-52
ii  libamd2.3.1                      1:4.2.1-3
ii  libarpack2                       3.1.5-3
ii  libatlas3-base [liblapack.so.3]  3.10.2-7
ii  libblas3 [libblas.so.3]          1.2.20110419-10
ii  libc6                            2.19-18
ii  libcamd2.3.1                     1:4.2.1-3
ii  libccolamd2.8.0                  1:4.2.1-3
ii  libcholmod2.1.2                  1:4.2.1-3
ii  libcolamd2.8.0                   1:4.2.1-3
ii  libcxsparse3.1.2                 1:4.2.1-3
ii  libfftw3-double3                 3.3.4-2
ii  libfftw3-single3                 3.3.4-2
ii  libfltk-gl1.3                    1.3.2-6+b1
ii  libfltk1.3                       1.3.2-6+b1
ii  libfontconfig1                   2.11.0-6.3
ii  libfreetype6                     2.5.2-3
ii  libgcc1                          1:4.9.2-10
ii  libgl1-mesa-glx [libgl1]         10.3.2-1
ii  libglpk36                        4.55-1
ii  libglu1-mesa [libglu1]           9.0.0-2
ii  libgomp1                         4.9.2-10
ii  libgraphicsmagick++3             1.3.20-3+deb8u1
ii  libgraphicsmagick3               1.3.20-3+deb8u1
ii  liblapack3 [liblapack.so.3]      3.5.0-4
ii  liboctave2                       3.8.2-4
ii  libqhull6                        2012.1-5
ii  libqrupdate1                     1.1.2-1
ii  libqscintilla2-11                2.8.4+dfsg-1
ii  libqt4-network                   4:4.8.6+git64-g5dc8b2b+dfsg-3
ii  libqtcore4                       4:4.8.6+git64-g5dc8b2b+dfsg-3
ii  libqtgui4                        4:4.8.6+git64-g5dc8b2b+dfsg-3
ii  libstdc++6                       4.9.2-10
ii  libumfpack5.6.2                  1:4.2.1-3
ii  libx11-6                         2:1.6.2-3
ii  octave-common                    3.8.2-4
ii  texinfo                          5.2.0.dfsg.1-6

Versions of packages octave recommends:
ii  gnuplot-qt [gnuplot-x11]  4.6.6-2
ii  libatlas3-base            3.10.2-7
ii  pstoedit                  3.62-2+b1

Versions of packages octave suggests:
pn  octave-doc      <none>
pn  octave-htmldoc  <none>
pn  octave-info     <none>
Attachment:
plot_3-8-2.jpg
Description: JPEG image
Attachment:
plot_3-6-2.jpg
Description: JPEG image