On Sun, 26 Sep 2010 13:38:21 +0200
Thomas Weber <tweber@debian.org> wrote:

> Hi Yann,
> On Sun, Sep 26, 2010 at 02:45:45AM +0200, Yann Vernier wrote:
> > Package: octave3.2
> > Version: 3.2.4-7
> > Severity: normal
> >
> >
> > There is a bug in handling of 2d plots with Octave 3.2 and Gnuplot
> > 4.4.
> >
> > I found that while axis equal or axis square change the plot, both
> > on screen and in print, it does not calculate the ratios correctly.
> > Whatever it is setting seems dependent on the window shape, which
> > really should never affect the printout.
>
> Could you send some screenshots showing the problem? And please, don't
> use random values (i.e. rand() and friends), but someting easily
> reproducible.
>
> Thanks
> 	Thomas

Certainly.

This also led me to experiment a bit with what the calculations are
based on; the difference between axis and data ranges matters.
Also attaching the message in the screenshot, which contains the sample
code. (cut -d# may help you split it into gnuplot and octave scripts)
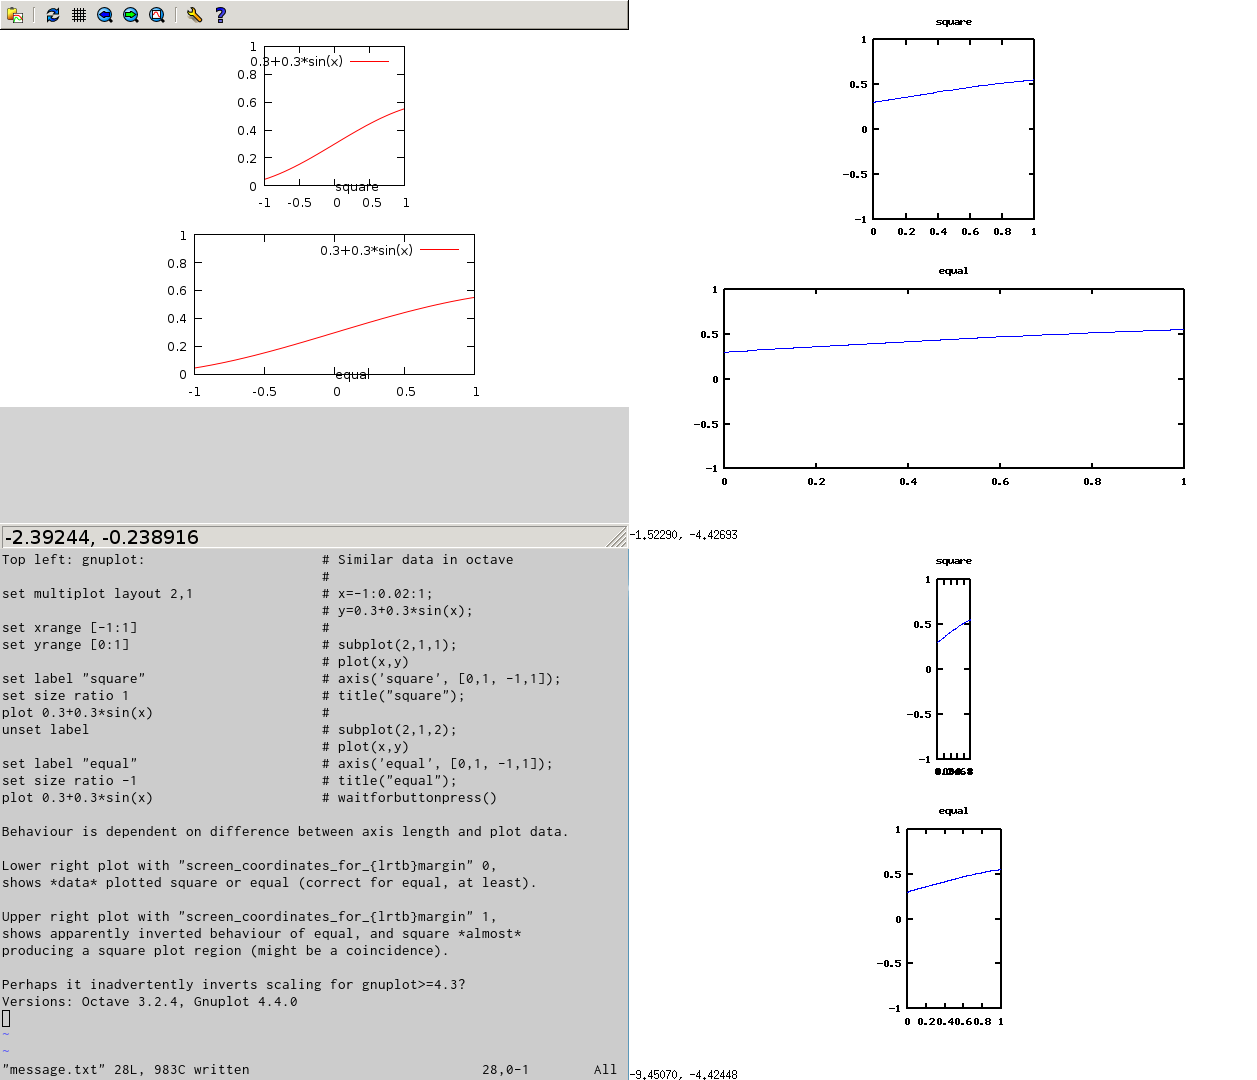
Top left: gnuplot:			# Similar data in octave
					#
set multiplot layout 2,1		# x=-1:0.02:1;
					# y=0.3+0.3*sin(x);
set xrange [-1:1]			#
set yrange [0:1]			# subplot(2,1,1);
					# plot(x,y)
set label "square"			# axis('square', [0,1, -1,1]);
set size ratio 1			# title("square");
plot 0.3+0.3*sin(x)			#
unset label				# subplot(2,1,2);
					# plot(x,y)
set label "equal"			# axis('equal', [0,1, -1,1]);
set size ratio -1			# title("equal");
plot 0.3+0.3*sin(x)			# waitforbuttonpress()

Behaviour is dependent on difference between axis length and plot data.

Lower right plot with "screen_coordinates_for_{lrtb}margin" 0,
shows *data* plotted square or equal (correct for equal, at least).

Upper right plot with "screen_coordinates_for_{lrtb}margin" 1,
shows apparently inverted behaviour of equal, and square *almost*
producing a square plot region (might be a coincidence).

Perhaps it inadvertently inverts scaling for gnuplot>=4.3?
Versions: Octave 3.2.4, Gnuplot 4.4.0
Attachment:
screenshot.png
Description: PNG image