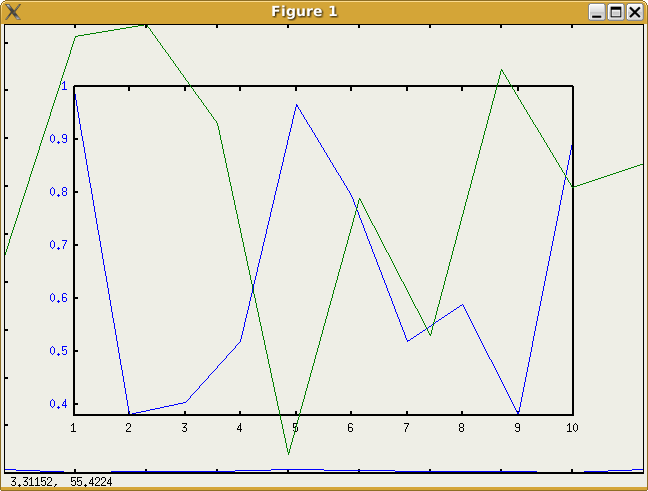
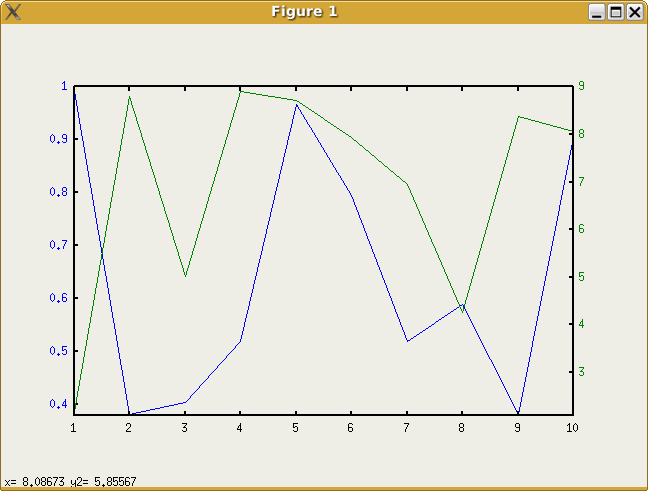
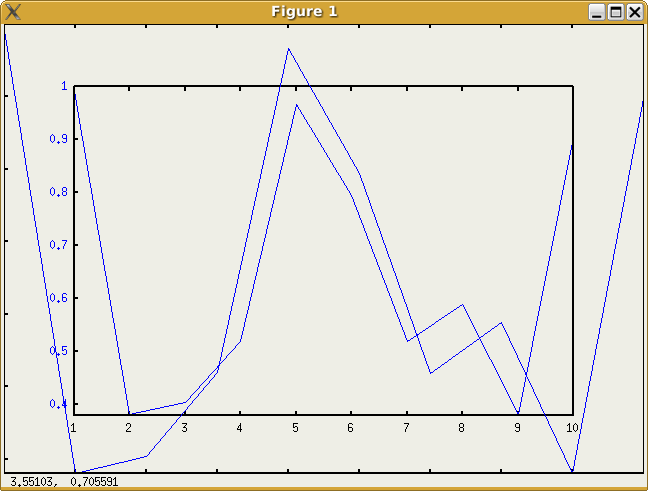
> On 01/04/08 17:11 +0100, Tom Wright wrote:
> > # The behaviour of this one has changed, but it's still not right.
> > # Now, it plots x and y as normal, but it also overlays a plot of x
> > # and y on axes which completely fill the graph window.  I can
> > # send you a screenshot if that helps - let me know.

On Tuesday 01 Apr 2008 at 21:14, Thomas Weber wrote:
> Yes, please.

After updating my computer today, this is in a worse state than it was
before - here's the results:

octave:1> x=[1:10];
octave:2> y=rand(size(x));
octave:3> z=rand(size(x))*10;
octave:5> plotyy(x,y,x,z)
(1.png)
octave:6> q=rand(size(x))*100;
octave:7> plot(x,y,x,q)
(2.png)
octave:8> plot(x,y)
(3.png)

The second graph is now broken again, though in a different way to how it was
before.  Let me know if you need any more diagnostics.

Tom
Attachment:
2.png
Description: PNG image
Attachment:
1.png
Description: PNG image
Attachment:
3.png
Description: PNG image
Attachment:
signature.asc
Description: This is a digitally signed message part.