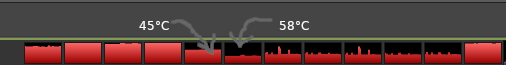
Package: mate-sensors-applet
Version: 1.24.1-1

I would like to be able to compare readings on graphs showing
temperature at a glance: if the bar on the disk temp is higher than
the CPU temperature graph, then it should mean that the disk
temperature is higher than the CPU's.

However, this is not currently the case: each graph is scaled
according to the sensor's min and max values, making graphs useless
without hovering for reading the actual values.  The attached
screenshot shows a disk temperature graph (left) seemingly higher than
the CPU temperature graph (right), but hovering reveals that the
opposite is true: disk is at 45 °C and CPU is at 58 °C.

Currently installed relevant packages:
```
Desired=Unknown/Install/Remove/Purge/Hold
| Status=Not/Inst/Conf-files/Unpacked/halF-conf/Half-inst/trig-aWait/Trig-pend
|/ Err?=(none)/Reinst-required (Status,Err: uppercase=bad)
||/ Name                       Version      Architecture Description
+++-==========================-============-============-==========================================================================
ii  mate-sensors-applet        1.24.1-1     amd64        Display
readings from hardware sensors in your MATE panel
ii  mate-sensors-applet-common 1.24.1-1     all          Display
readings from hardware sensors in your MATE panel (common files)
```

Thanks,
Riccardo
Attachment:
sensors-graph-bar.png
Description: PNG image